Company Setup
This information appears on all outputs and reports. Powered by the Work Backwards Framework.
ARR Operating Milestones and Timeline
Contract & Pricing Structure
How you price and structure contracts determines the shape of your revenue recognition.
Customer Segment
Choose the segment you sell to — this sets your funnel type. Each motion has different inputs and economics.
Sales Funnel Model — Work Backwards
From the gross-adds-per-month the Acquisition Plan requires, the funnel reverse-engineers the leads, SDRs, and reps needed to deliver them — and the CAC that implies.
Cost of Service
Two separate cost streams matching the two revenue streams. Year 1 implementation COS is typically high — companies often lose money in Year 1, which is expected and should show clearly in the model.
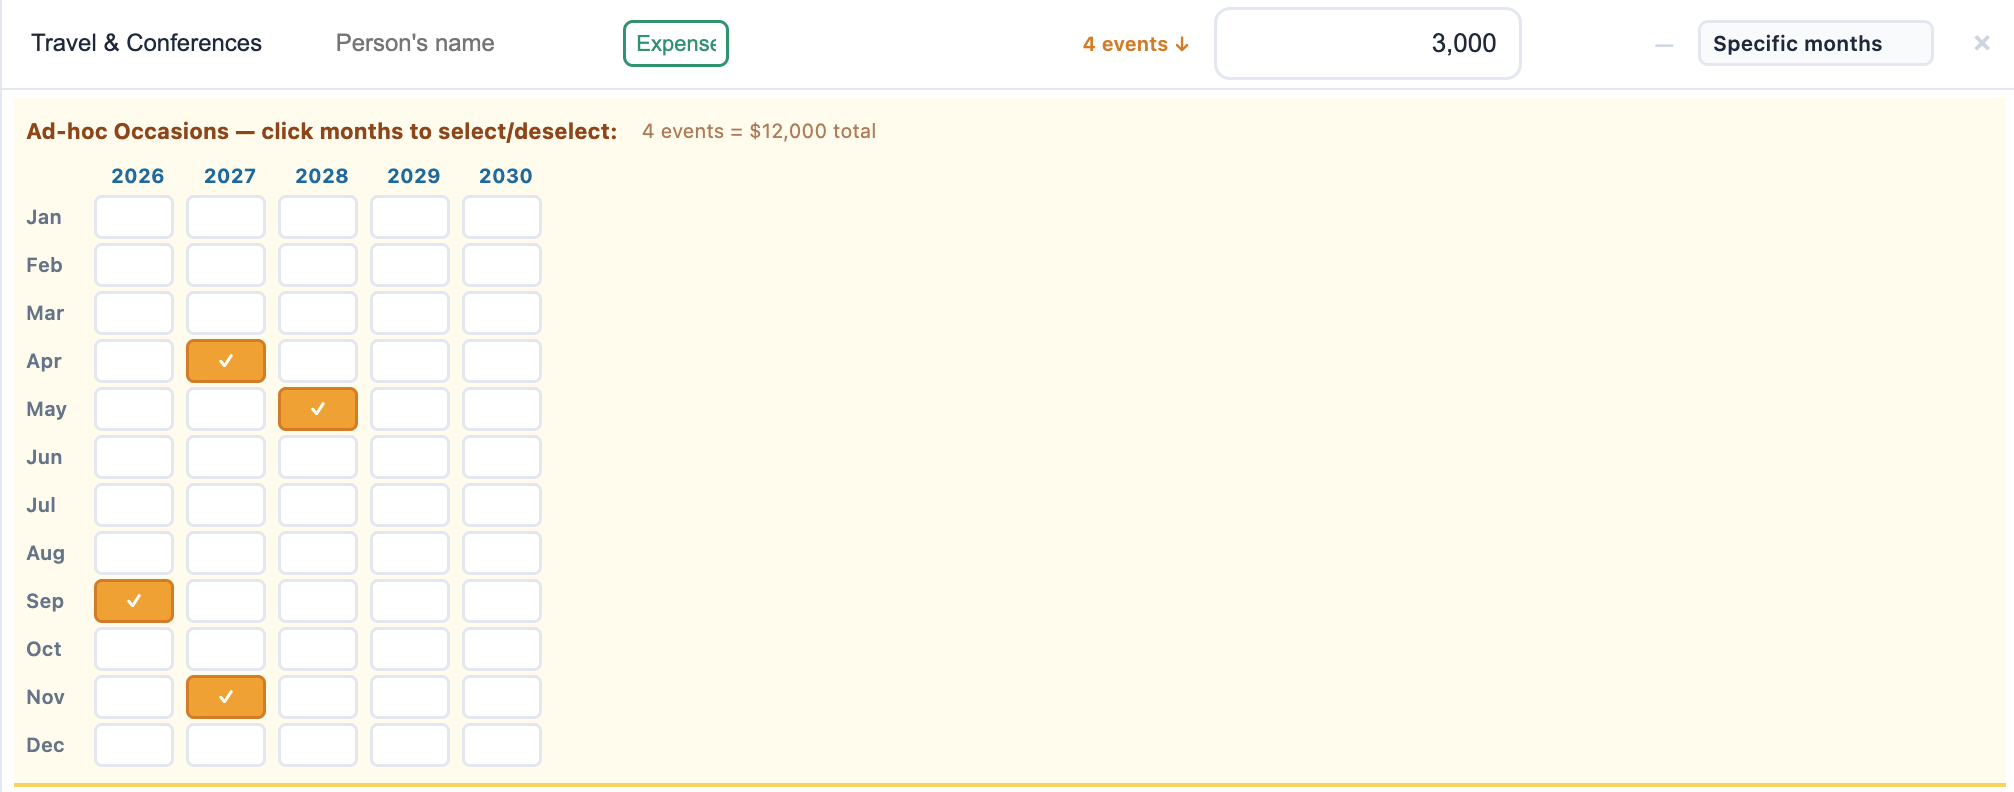
Sales & Marketing
| Line Item | Type | Start | End | Annual $ | %/yr | Mode |
|---|
Product & Engineering
| Line Item | Type | Start | End | Annual $ | %/yr | Mode |
|---|
G&A
| Line Item | Type | Start | End | Annual $ | %/yr | Mode |
|---|
Balance Sheet Assumptions
The pieces a pure P&L misses: computers you capitalize, money customers owe you (AR), money you owe vendors (AP), and — the big SaaS one — cash collected up front on annual prepay (deferred revenue). Leave anything at zero; grey text is a suggested starting point, not a default.
Balance Sheet & Cash Flow
⭐ Milestone years highlighted. Shows how working capital and CapEx turn EBITDA into actual cash — including the deferred-revenue tailwind from prepaid customers.
Cash flow (indirect): EBITDA − ΔAR + ΔAP + ΔDeferred Revenue − CapEx + Equity Raised = Net cash change. Taxes and interest excluded (pre-profit stage). PP&E depreciates straight-line; depreciation is non-cash. Working-capital balances driven by DSO / DPO / prepay above.
ARR Growth vs Milestones
Revenue by Stream
Cash Balance & Burn Rate
6-Year Financial Model
⭐ Milestone years highlighted. All figures annual. GAAP revenue recognition with deferred revenue and AR.
* Revenue recognition: license fee amortized monthly (GAAP). Implementation fee recognized over months 1–2 of contract. AR assumes 45-day payment terms. OpEx scales with ARR growth from Year 1 base. Raise sizes include 25% buffer.
3-Statement Model
Income statement, cash flow, and balance sheet tied together by the same engine. ⭐ milestone years. Toggle monthly to see exactly when one-off costs and raises land.
Cash flow (indirect): EBITDA ± working-capital changes − CapEx + equity raised. Balance sheet shows the working-capital + CapEx items; "Net Assets" = total assets − total liabilities (full equity/retained-earnings not built out at this scope). Taxes and interest excluded (pre-profit stage).
Timeline & Goals
Your fundraising journey on one page — the ARR you need to hit at each round, the raise that funds the burn to get there, and the milestones along the way. This is the destination; the rest of the model is how you reach it.
Example of Timeline
Live preview — fills in with your own numbers as you enter rounds below.
Rounds & goals
KPI Summary
Annual operating metrics across the 6-year forecast. Milestone years highlighted. All % of ARR metrics are SaaS efficiency benchmarks — best-in-class targets shown for reference.
GRR = Gross Revenue Retention (1 − annual churn). NRR = Net Revenue Retention — equals GRR until upsell/expansion revenue is modeled. OpEx % benchmarks: S&M 30–50% of ARR (early stage), Product 20–30%, G&A 10–15%.
Monthly Revenue Waterfall
MRR build, client counts, and revenue by stream — month by month.
Monthly 3-Statement Model
Income Statement, Balance Sheet items, and Cash Flow — month by month.
Budget vs Actual
Budget column auto-populates from the model. Enter actuals manually or use the QBO/Xero Import tab to paste them. Variance = Actual minus Budget.
Step 1 — Paste Your QBO / Xero P&L Export
Export a P&L from QuickBooks Online or Xero (any date range), then paste the raw data below. Use tab-separated or comma-separated format.
Step 2 — Map Your Accounts to Model Categories
For each of your QBO/Xero account names, select the corresponding model category. This tells the model where each actual figure belongs.
| Your QBO / Xero Account Name | Maps To (Model Category) | Notes |
|---|
Step 3 — Apply to Budget vs Actual
Once mapping is complete, click below to push the actuals into the Budget vs Actual tab.